Body Size
Note about browsers: This site works best using Google Chrome or Firefox. If any of the graphics look funny, please check what browser you’re using. Internet Explorer won’t display properly unless you’re using IE version 9.0 or later. Enjoy the data!
—————-
The body size data here represent thousands of people who have participated in our research events at school and community health fairs as volunteer research subjects. At the body composition station, these individuals had their height, weight, waist circumference, body mass index (BMI), and body fat percentage recorded. Click here for more about measurement details, how we determined recommendations and more.
Tools
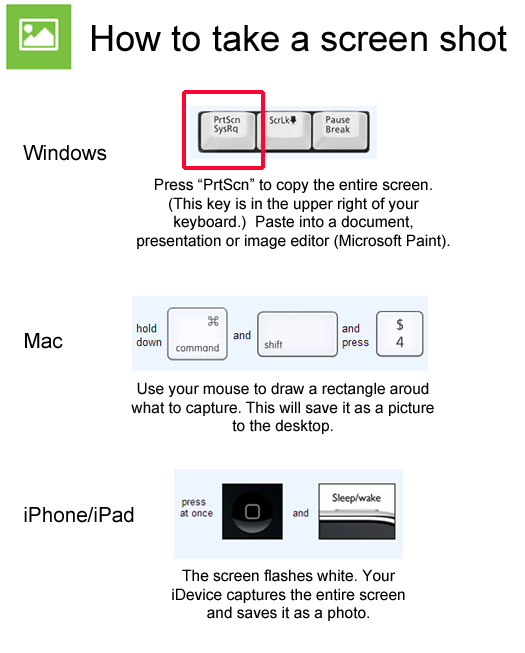
For more details on how to paste your screenshot into a document, presentation or image editor, please visit our help page.
The graphics above show the average height and weight for participants completing this station. Use the tools menu to customize these graphics or find out more about how they’re measured.
BMI is a number calculated based on a person’s weight and height. It provides an indicator of body fatness and is used most often to determine weight categories linked to later health problems. BMI doesn’t take into account muscle mass (which weighs more than fat), so some athletic individuals can have larger BMIs for this reason. BMI recommendations are different for males and females, plus they change every month until a person is 20 years old! Use the tools menu to customize this graph, find out more about this station, and how we determine recommendations.
Body fat percentage is measured using special scales that send a very small electrical current through the body (bioimpedance). It provides a reliable measure of body fatness, though it is difficult to measure in most situations since it requires specialized equipment. This is why BMI is used more frequently. Recommendations for body fat percentage change based on a person’s age and gender. Use the tools menu to customize this graphic, find out more about this station and how we determine recommendations.