Diet
Note about browsers: This site works best using Google Chrome or Firefox. If any of the graphics look funny, please check what browser you’re using. Internet Explorer won’t display properly unless you’re using IE version 9.0 or later. Enjoy the data!
—————-
The diet data here represent hundreds of people who have participated in our research events at school and community health fairs as volunteer research subjects. At the diet station, these individuals answer a computer questionnaire about their eating habits. The recommendations for each of these vary based on an individual’s age and gender. Currently, the information about dairy intake, fruit & vegetable intake, and added sugar intake are available below. Click here for more about the diet questionnaire details, how we calculated diet recommendations, and additional resources.
Tools
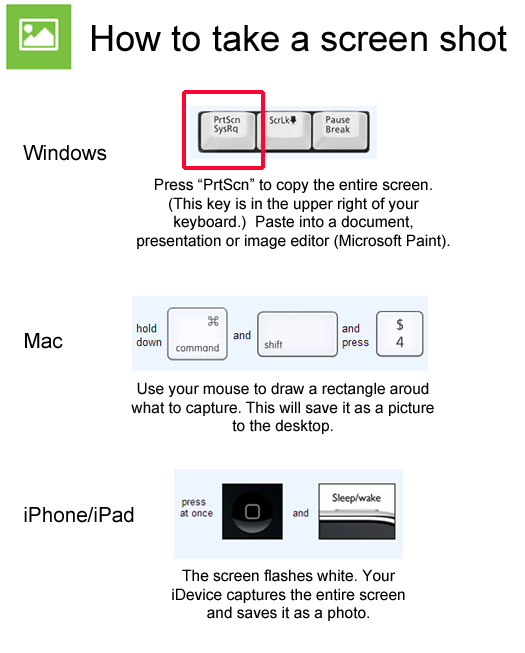
For more details on how to paste your screenshot into a document, presentation or image editor, please visit our help page.
Dairy intake is estimated from each person’s responses to four questions on the NHANES 2009-2010 dietary screener. These questions ask how often a person drinks or eats dairy products, like milk, cheese, ice cream and pizza . Daily recommendations for dairy intake vary by age and are 2 cups (2-3 years), 2.5 cups (4-8 years), and 3 cups for ages 9 and older.
Fruit and vegetable intake is estimated from each person’s responses to ten questions on the NHANES 2009-2010 dietary screener. These questions ask how often a person eats foods such as fruit, juice, salad, potatoes, beans, tomato sauce, salsa and pizza. Daily recommendations vary from 2 cups to 5 cups based on a person’s age and gender! Use the tools feature to explore the data based on age, see how the recommendations change, and how we used to calculate fruit and vegetable intake prior to September 2012!
Added sugars are estimated from each person’s responses to seven questions on the NHANES 2009-2010 dietary screener. These questions ask how often a person drinks soda, fruit drinks, sugar or honey in their coffee or tea as well as how often they eat doughnuts, ice cream, cake, pie and cookies. It is recommended that females consume less than 6 teaspoons per day and males consume less than 9. Use the tools feature to see if added sugar intake changes based on age or gender.