Demographics
Note about browsers: This site works best using Google Chrome or Firefox. If any of the graphics look funny, please check what browser you’re using. Internet Explorer won’t display properly unless you’re using IE version 9.0 or later. Enjoy the data!
—————-
The demographic data here represent thousands of people who have participated in our research events at school and community health fairs as volunteer research subjects. At the entry station, participants use a computer kiosk to electronically enter their age, gender, race, and ethnicity. This information is then used to tailor the survey questions, recommendations, and feedback that each individual receives. Click here for more information about how individuals enroll in our study and what these demographics mean.
Tools
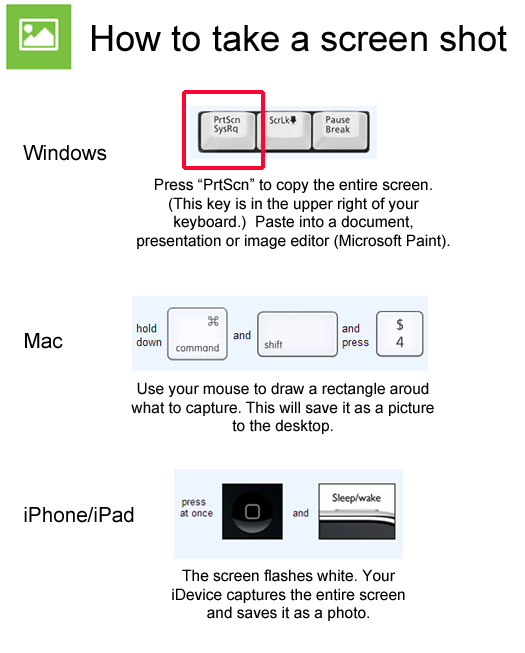
For more details on how to paste your screenshot into a document, presentation or image editor, please visit our help page.
These are the number of people who participated in our exhibit as an anonymous research participant. The data here represent cross-sectional data, meaning they were collected at a single point in time. The data here do not include those who participated in our cohort studies, which are long-term studies that follow individuals over time. See here for more information about study types.
You’ll notice that the overall average age is very different from the median (middle) age. That’s because we hold fairs in both communities and schools, which have very different age groups. Use the tools menu to customize the data — select school or community locations to see how the average and median ages change. Our materials and feedback tailor based on the gender and age of the participant.
The National Institutes of Health, who fund most of our research, require that we report the race and ethnicity of everybody who has participated in our research. Ethnicity and race are different categories and are asked about in separate questions. Ethnicity relates to cultural factors such as nationality, culture, ancestry, language and beliefs — see here for more information about this measure. We only ask about Hispanic or Latino ethnicity as part of our study.
We use racial categories provided by the National Institutes of Health. Race refers to a person’s physical appearance (such as skin color, eye color, hair color, bone/jaw structure) that result from genetic ancestry — see here for more information about how race and ethnicity differ. Participants can select between six categories for race.